Collecting metrics is very important because it gives us an understanding of
how many tests we have, what kinds they are, and what's generally
happening with automation.
how many tests we have, what kinds they are, and what's generally
happening with automation.
**I recommend collect only from the MAIN branch.
What were we interested in?
- We were interested in which tests were the longest.
- How often we run tests per day
- (since we knew how much an hour of CI costs
- and it was important for us to understand the time).
- How long we wait for the build (and all tests).
- The number of tests at each level (unit, API, end-to-end, etc.)
- PASSED/FAILED/SKIPPED.
- Whether there are flaky tests? Which ones specifically?
- Whether we rerun tests, and how many times?
A very popular question: Why use DataDog reports if you can just look at the history of native reports (for example, in allure)?
Allure will NOT give you the full picture. It will only give you information about end-to-end tests. And not all of it. You won't see how many times you've run the build, how long it ran, and how long the tests took.
The same goes for the Jenkins dashboard. You will only see very limited information that does not give a full picture.
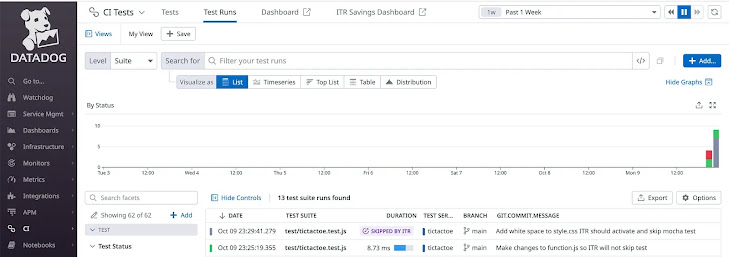
How to know you're doing it right?In Grafana or DataDog, the full information about the test should be displayed.
What mistakes do I often see for TEST? For some reason, many people send some custom data to DataDog/Grafana.You shouldn't do that.
- It could be a variable with the number of tests,
- the names of tests,
- the number of failed tests,
- or the number of reruns.
Send your test reports FULLY in raw form. Then DataDog will be able to understand that it's actually a test and you will see on the TEST tab - the actual tests and will be able to extract all the information you could want.
You can make a dashboard that answers the important questions for your project.
- If you send reports correctly
- you will see them on the test page.
- If you don't see them there
- then you are sending something incorrectly.
EXAMPLE OF CIRCLE CI CONFIG:

 steps:
          - run:
              name: "Install DataDog"
              when: always
              command: |
                npm install -g @datadog/datadog-ci
          - run:
              name: "Send test reports to DataDog"
when: always
command: |
DD_ENV=ci DATADOG_API_KEY=$DATADOG_API_KEY datadog-ci junit
upload --service <REPO NAME> <PATH WITH YOUR REPORTS> --tags integration ___________**tags: put integration / end2end / API / contract / etc -it will help you filter data on dashboardAND THEN....Then go to the dashboard tab and extract the data you want to see
(you could break it down by sections: unit, API, e2e, localization, etc).
It is advisable to use a TEMPLATE - to do it once and the same for all tests. So you could see if you build your piramid in correct way:


Comments
Post a Comment